When the SAP system was large simple when there was only part of the ABAP
system, and the words "Java" and "SAP" and no one thought to pronounce
together, the administrator updates the system gradually, slowly, savoring
each step:
The documentation for the utility is available in the section "Documentation
→ System → Maintenance Updating SAP Systems Using Software Update
Manager 1.0 SP14. When downloading, you must select the desired platform
(operating system and database) (fig. 2).
system, and the words "Java" and "SAP" and no one thought to pronounce
together, the administrator updates the system gradually, slowly, savoring
each step:
- First, updated utility SPAM/SAINT. This transaction is used for SPAM.
- Then updated the kernel- SAP Kernel.
- If you need to install/update the Add-ons (add-on) then used transaction
SAINT. - Well, in the end, using transaction SPAM queue drew out for packs of one
or the other system - components, and produced imports.
When in the ABAP system has become more of a component, SAP began to
produce (1-2 times in half a year) or packs stacks Support Package Stack (SPS).
This is a set of packages support or rather, recommendations on updating
of all components of the system with the recommended level of the SAP Kernel.
This mechanism has facilitated the downloading, installation and package
tracking support for all components of the system while providing a guarantee
operation of the system after the upgrade.
produce (1-2 times in half a year) or packs stacks Support Package Stack (SPS).
This is a set of packages support or rather, recommendations on updating
of all components of the system with the recommended level of the SAP Kernel.
This mechanism has facilitated the downloading, installation and package
tracking support for all components of the system while providing a guarantee
operation of the system after the upgrade.
When JAVA appeared part of the system, update it just fell on the shoulders
of the administrator.
Originally, it was used for this purpose utility JSPM.
of the administrator.
Originally, it was used for this purpose utility JSPM.
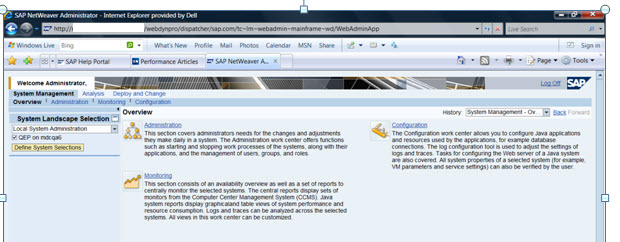
This example updates the systems based on SAP NetWeaver 7.0 (ABAP + JAVA)
At the moment there is utility Software Update Manager SAP or just SUM.
One of the purposes of SUM is updated ABAP and JAVA stack system.
And if the ABAP system can be updated-the old fashioned way, through
transaction SPAM/SAINT update, JAVA stack system using JSPM already is
strongly discouraged. Only The SUM.
And if the ABAP system can be updated-the old fashioned way, through
transaction SPAM/SAINT update, JAVA stack system using JSPM already is
strongly discouraged. Only The SUM.
To download the SUM utility 1.0 , you must log on to the SAP Support Portal
at the link http://service.sap.com/sltoolsetthere to link the Software Logistics
Toolset 1.0 "and" General
Information "section to download the latest version (fig. 1).
at the link http://service.sap.com/sltoolsetthere to link the Software Logistics
Toolset 1.0 "and" General
Information "section to download the latest version (fig. 1).
 |
| Figure. 1. Software Update utility Download Manager. |
The documentation for the utility is available in the section "Documentation
→ System → Maintenance Updating SAP Systems Using Software Update
Manager 1.0 SP14. When downloading, you must select the desired platform
(operating system and database) (fig. 2).
 |
| Figure. 2. Download the documentation for the Software Update Manager. |
To install or update (if an older version of) utility Software Update Manager
.0, you must unzip the downloaded archive into a directory of
SAR \usr\sap\ <SAPSID> \SUM, running the command type
(example, MS Windows):
.0, you must unzip the downloaded archive into a directory of
SAR \usr\sap\ <SAPSID> \SUM, running the command type
(example, MS Windows):
> SAPCAR-xvf <SUM_archive>. SAR-R \usr\sap\ <SAPSID>
Note the big utility and decompression time decent. :)
The launch takes place on the server side and client side The backend is
activated through the launch of under User Administrator (for MS Windows)
executable file "\usr\sap\ <SAPSID> \SUM\STARTUP. BAT '
(fig. 3).
The client part is a Java application (fig. 4) that runs through your browser,
the URL resembles the following:
Basic requirements: because Software Update Manager uses SAP for Host Agent,
you must manually update. Details can be found here all part of the SAP system
must be running.
Useful SAP notes utility:
SAP note # 2084104-Central Note-Software Update Manager 1.0 SP14,
SAP note # 2115547-Oracle: Add. Information-Software Update Manager1.0
My feelings from using conflicting utility. I like old soldiers, not knowing
the words love, love to oversee all stages of the process. As for here, indeed,
the work of the utility is going the same as and when on-step update.
The only innovation: creating clone a tablespace with programs (PSAPSR3XXX)
and import updates in it, and then switch to it as primary.
Thus, reduced downtime (down-time) system, but grow requirements
on your hard disk.
activated through the launch of under User Administrator (for MS Windows)
executable file "\usr\sap\ <SAPSID> \SUM\STARTUP. BAT '
(fig. 3).
 |
| Figure. 3. start the server side of the SUM utility 1.0. |
The client part is a Java application (fig. 4) that runs through your browser,
the URL resembles the following:
http://<server_host>: 4329
 |
| Figure. 4. screen Sample SUM utility 1.0. |
Basic requirements: because Software Update Manager uses SAP for Host Agent,
you must manually update. Details can be found here all part of the SAP system
must be running.
Useful SAP notes utility:
SAP note # 2084104-Central Note-Software Update Manager 1.0 SP14,
SAP note # 2115547-Oracle: Add. Information-Software Update Manager1.0
My feelings from using conflicting utility. I like old soldiers, not knowing
the words love, love to oversee all stages of the process. As for here, indeed,
the work of the utility is going the same as and when on-step update.
The only innovation: creating clone a tablespace with programs (PSAPSR3XXX)
and import updates in it, and then switch to it as primary.
Thus, reduced downtime (down-time) system, but grow requirements
on your hard disk.