SAP Java monitoring check list
To check “Logs and Traces”, navigate to System Management -> Monitoring ->
Logs and Traces
From the drop down box, different logs can be checked
Process list – List of processes that are currently running can be viewed here and any long running process can be identified and actioned accordingly.
Using Management Console for monitoring Java System :
To open management console for SAP systems based on Unix operating system, add 13 for the port of the portal as mentioned below
A screen similar to below screen will appear :
You can drill down further on SID of the system to view database, Central and SCS instance details as below :
Please note that Management Console can be accessed even when java is down for a sap system.
You can check database status as below :
You can check the javanode status as below:
Status should be running here if java is up
Process list – List of processes that are currently running can be viewed here and any long
running process can be identified and actioned accordingly.
SDM, Dispatcher, Server0 and server1 node status can be checked here:
Various work directory logs, availability log, application log and default trace can be checked here :
Availability log :
Sapstart log:
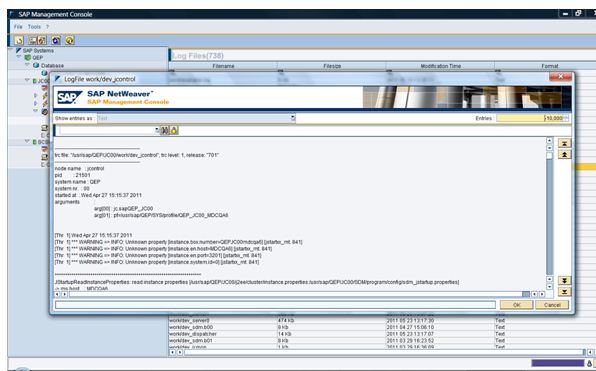
Dev_jcontrol log :
Dev_server0 log :
To check the status of the message and enqueue servers, check the process list under scsinstance as mentioned below :
To check various logs related to message server, enqueue server, jcmon check the logs under SCS instance as mentioned below :
Related Link :


No comments:
Post a Comment